NMR-based metabolomics workflow
Sample preparation (~30 minutes)
1: Filtration: Amicon Ultra-0.5 Centrifugal FilterTube, Centrifuge the sample for ~30 minutes at 13,000 rpm
2: Internal Standard Solution & pH (4-9): 5 mM DSS-d6 in D2
For optional pH measurement in Processor, add one or more of 100 mM imidazole, 100 mM creatinine and 20 mM DFTMP.
Details can be found at Chenomx site
Spectral Data Acquisition (~10 minutes, can be easily automated with autosampler)
1: NOESY pulse sequences with tmix of 100 ms, Temperature = 25 °C Acquisition time = 4 s Relaxation delay = 1 s Spectral width = 12 ppm
2: Ensure that the water peak is centered in your spectra because automatic detection of DSS/TSP relies on the water peak being centered.
3: Shimming
IMSERC has one of the most popular metabolomics software packages, Chenomx, available for our users to analyze their data:
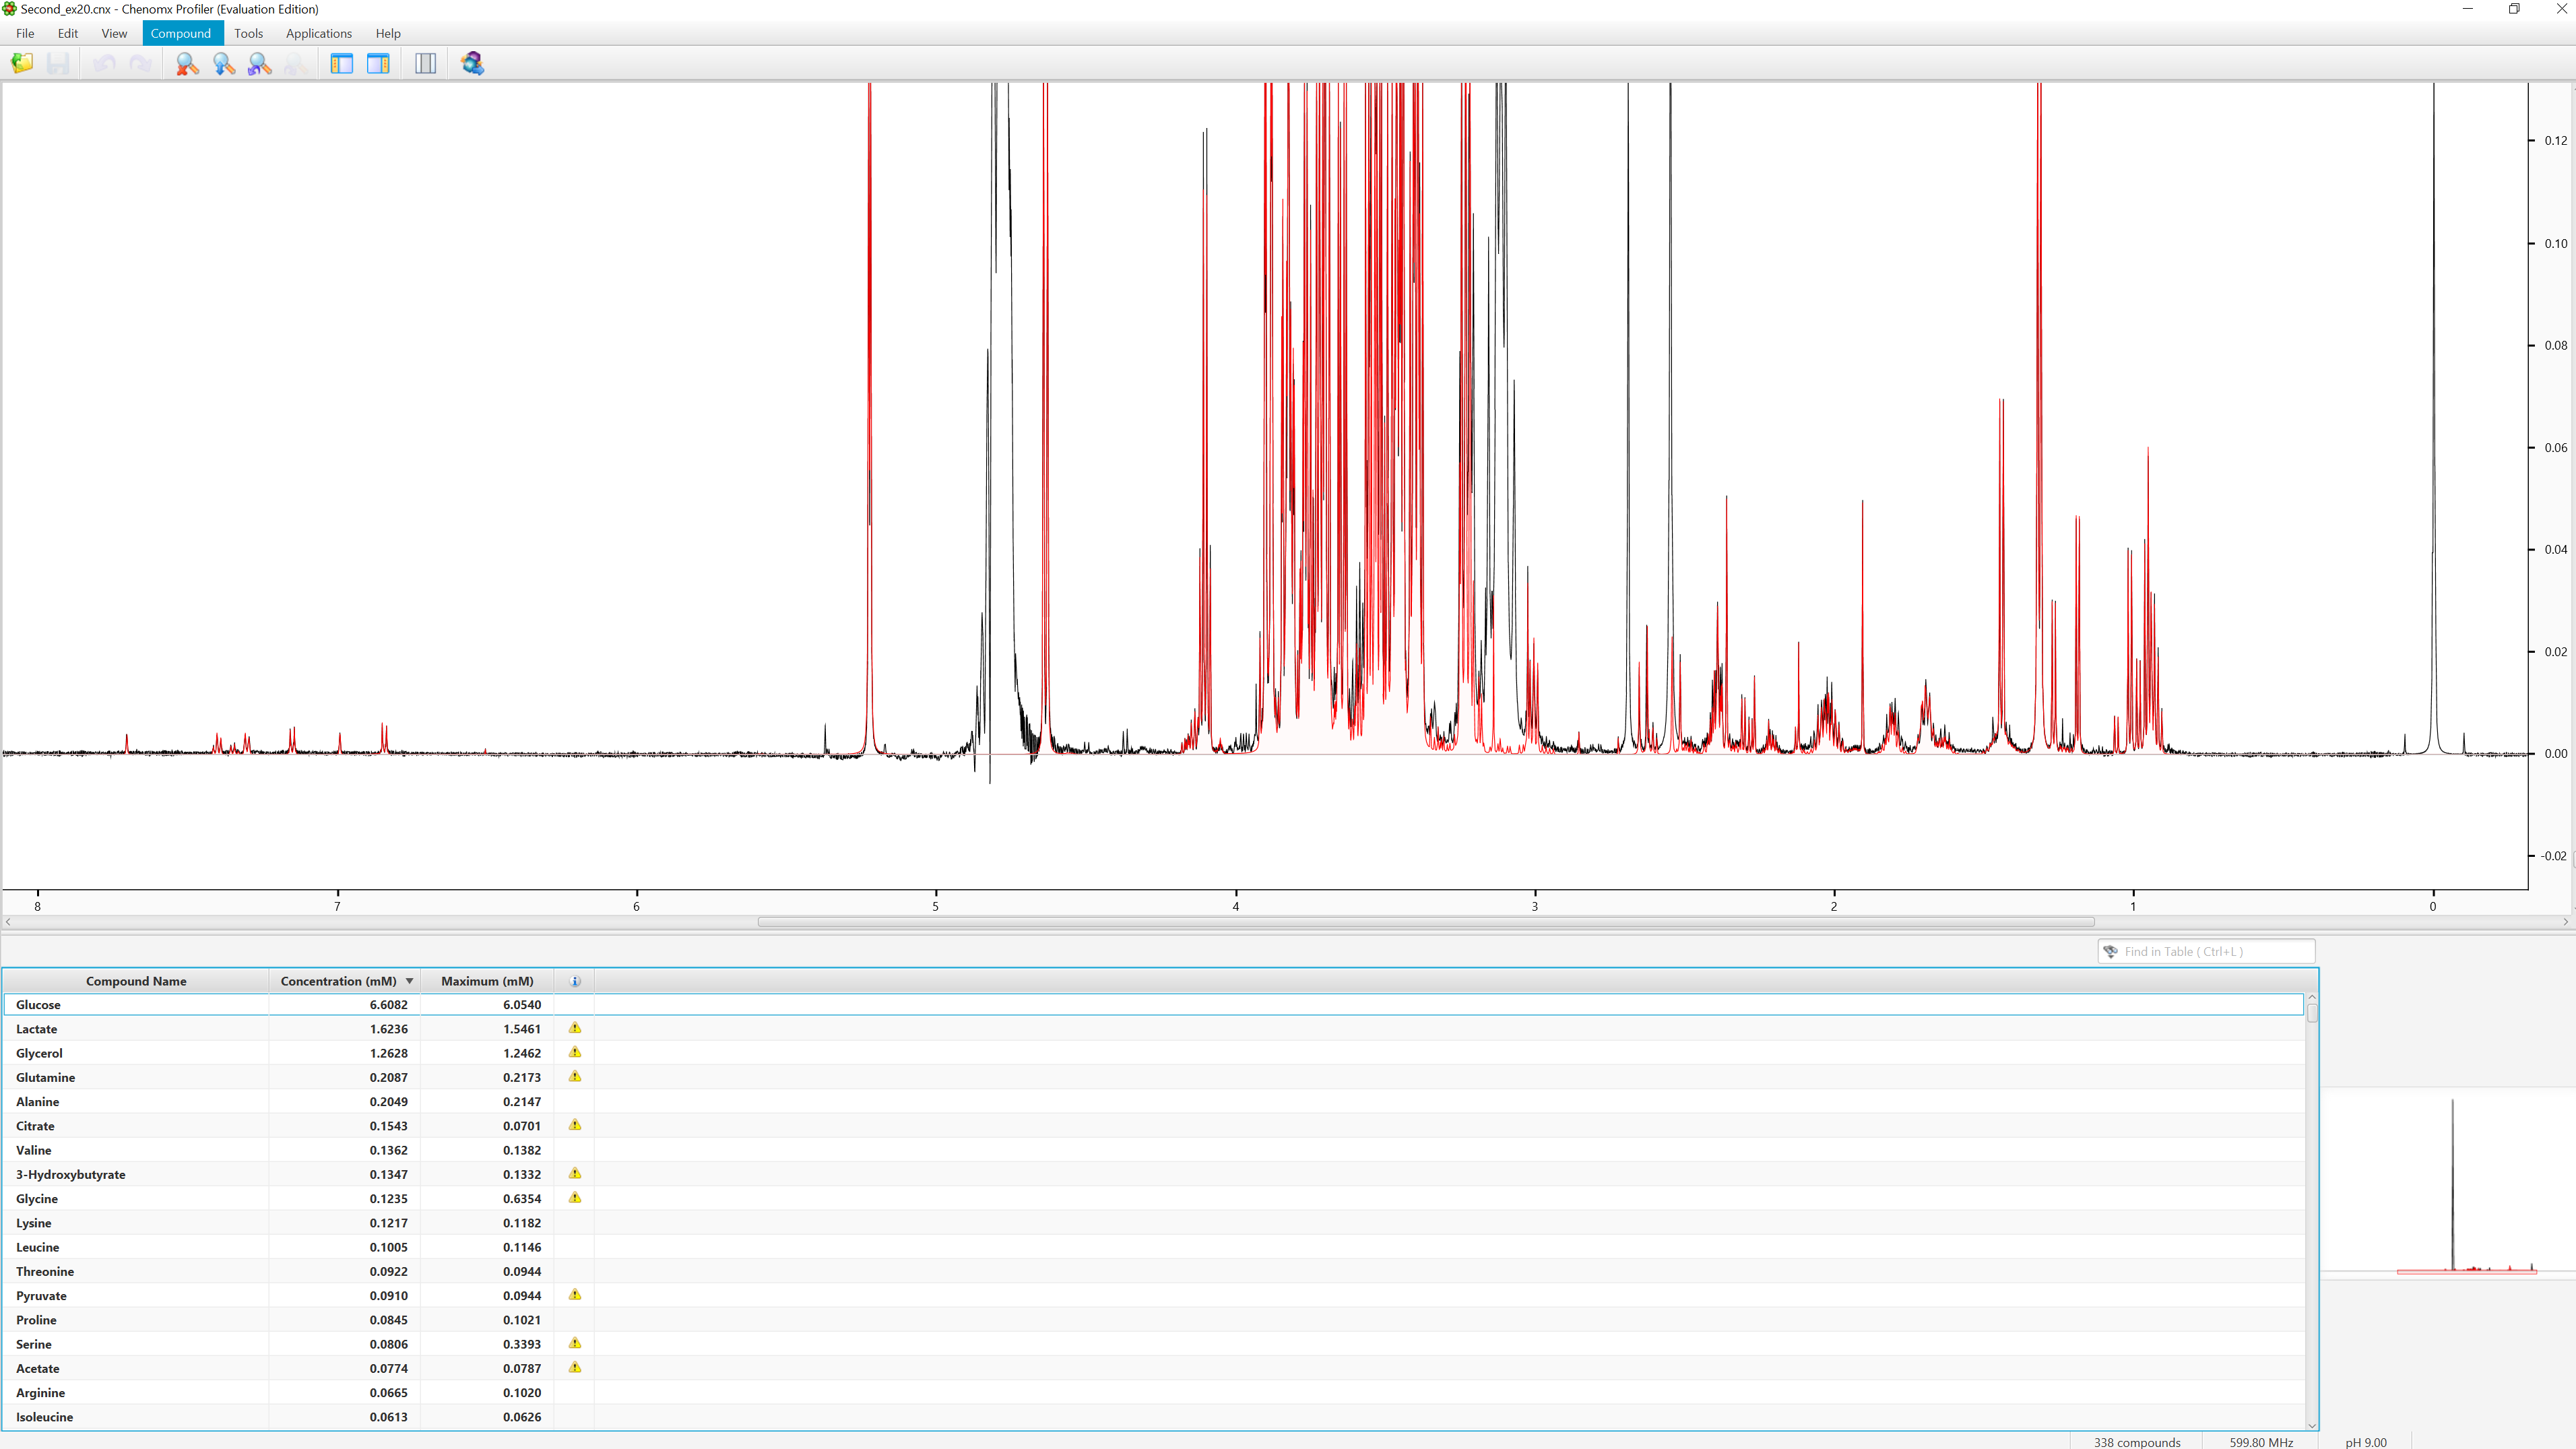
1: For targeted profiling, the result is that 1D H NMR spectra can be turned into tables of identified compounds and their concentration in a convenient and straightforward way (Figure below shows profiling for a plasma sample).
2: The untargeted profiling will generate plots showing the clusters and differences for a series of samples.
1: Export results to excel format
